Warning: "continue" targeting switch is equivalent to "break". Did you mean to use "continue 2"? in /home/calcul9/public_html/wp-content/themes/suffusion/functions/media.php on line 580

Warning: "continue" targeting switch is equivalent to "break". Did you mean to use "continue 2"? in /home/calcul9/public_html/wp-content/themes/suffusion/functions/media.php on line 583

Warning: "continue" targeting switch is equivalent to "break". Did you mean to use "continue 2"? in /home/calcul9/public_html/wp-content/themes/suffusion/functions/media.php on line 586

Warning: "continue" targeting switch is equivalent to "break". Did you mean to use "continue 2"? in /home/calcul9/public_html/wp-content/themes/suffusion/functions/media.php on line 589

Warning: "continue" targeting switch is equivalent to "break". Did you mean to use "continue 2"? in /home/calcul9/public_html/wp-content/themes/suffusion/functions/media.php on line 592
2013 March 27 » The Calculating Investor

About two years ago, I posted some region by region plots of the Case-Shiller home price data. I thought it would be interesting to re-run those plots to see how things have changed since 2011.

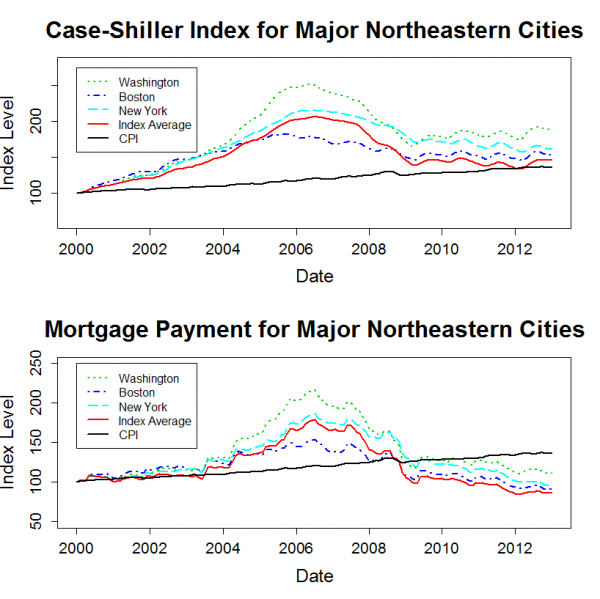
The plots below show the housing price history for major cities within each region. Each plot also includes the 20 city average data series.  Each city’s price history is normalized to 100 in January 2000.  Since the Case-Shiller data is not adjusted for inflation, I also added a normalized CPI-U series to each plot.

The “Mortgage Payment” plot shows the price indices adjusted to account for changing mortgage rates.  This plot incorporates both the Case-Shiller data and the mortgage rate to show how the payments for a 30 year fixed rate mortgage have varied for a “constant-quality” home.

northeast_shiller Continue reading »